Written on
How To: Multiple Plots on a Single Panel in R
Found in [R] by @awhstin on
It has been awhile since I have posted a tutorial, or anything for that matter, on my website so I decided to revisit some data from my old post.
If you recall in that quick little visualization I just wanted to plot this great new data set. It was just a snapshot of the area with the most action but I really didn’t dive too deeply into the data. There was a time crunch I was dealing with that really limited my interest into the post which is why it was such a brief and fairly simple post.This new post is two-fold. I want to revisit and give a little more of the sample code and data I used, as well as a useful little addition for the business users who read this.
One of the most useful things I have found in business applications of R is the ability to plot multiple graphs on a single panel. Which I will detail in this post after we get some data to work with.
First you will need the CLIWOC data I have messed with, which can be found on the CLIWOC website.
Then you will want the shapefile I used to create the minimalist plot which can be downloaded from this link. The reason I wanted to use these shapefiles instead of leveraging the google street maps and other really easy R mapping tools is because of design preferences. Too many times have I seen what could have been a decent chance at a touch of character and design in data presentation fall by the wayside to ease and quick production. I really like the simple contrast and colors against the minimalist maps.
Great let’s start:
You may download the full R code from my Github called MultiMap.
First you will need to download or select the Maptools Package and instantiate the CSV you have downloaded.
spain<-fm[fm$Nation=="Spain",]
france<-fm[fm$Nation=="France",]
nether<-fm[fm$Nation=="Nederland",]
uk<-fm[fm$Nation=="United Kingdom",]
Great! We now have points for our plots. Now we will use a function from our package we called in to read our shapefile we downloaded.
But since the object of this post is to arm the reader with the ability to plot multiple graphs on a single panel first we will use the par() function (layout can also be used) to create our panel dimensions. As you can see you can set the dimensions with the “2,2” values, say you wanted 3,3 or even 2,3. Now we will start with the plotting on our panel. The order is specifically important as you need to plot the points after each plot instance to match them with the right chart.
old.par <- par(mfrow=c(2, 2))
plot(shape,lwd=.3, main="Spain")
points(spain$Lon3,spain$Lat3,cex=.01, pch=19, col="red4")
plot(shape,lwd=.3, main="France")
points(france$Lon3,france$Lat3,cex=.01, pch=19, col="royalblue4")
plot(shape,lwd=.3, main="Nederland")
points(nether$Lon3,nether$Lat3,cex=.01, pch=19, col="sienna1")
plot(shape,lwd=.3, main="United Kingdom")
points(uk$Lon3,uk$Lat3,cex=.01, pch=19, col="gray78")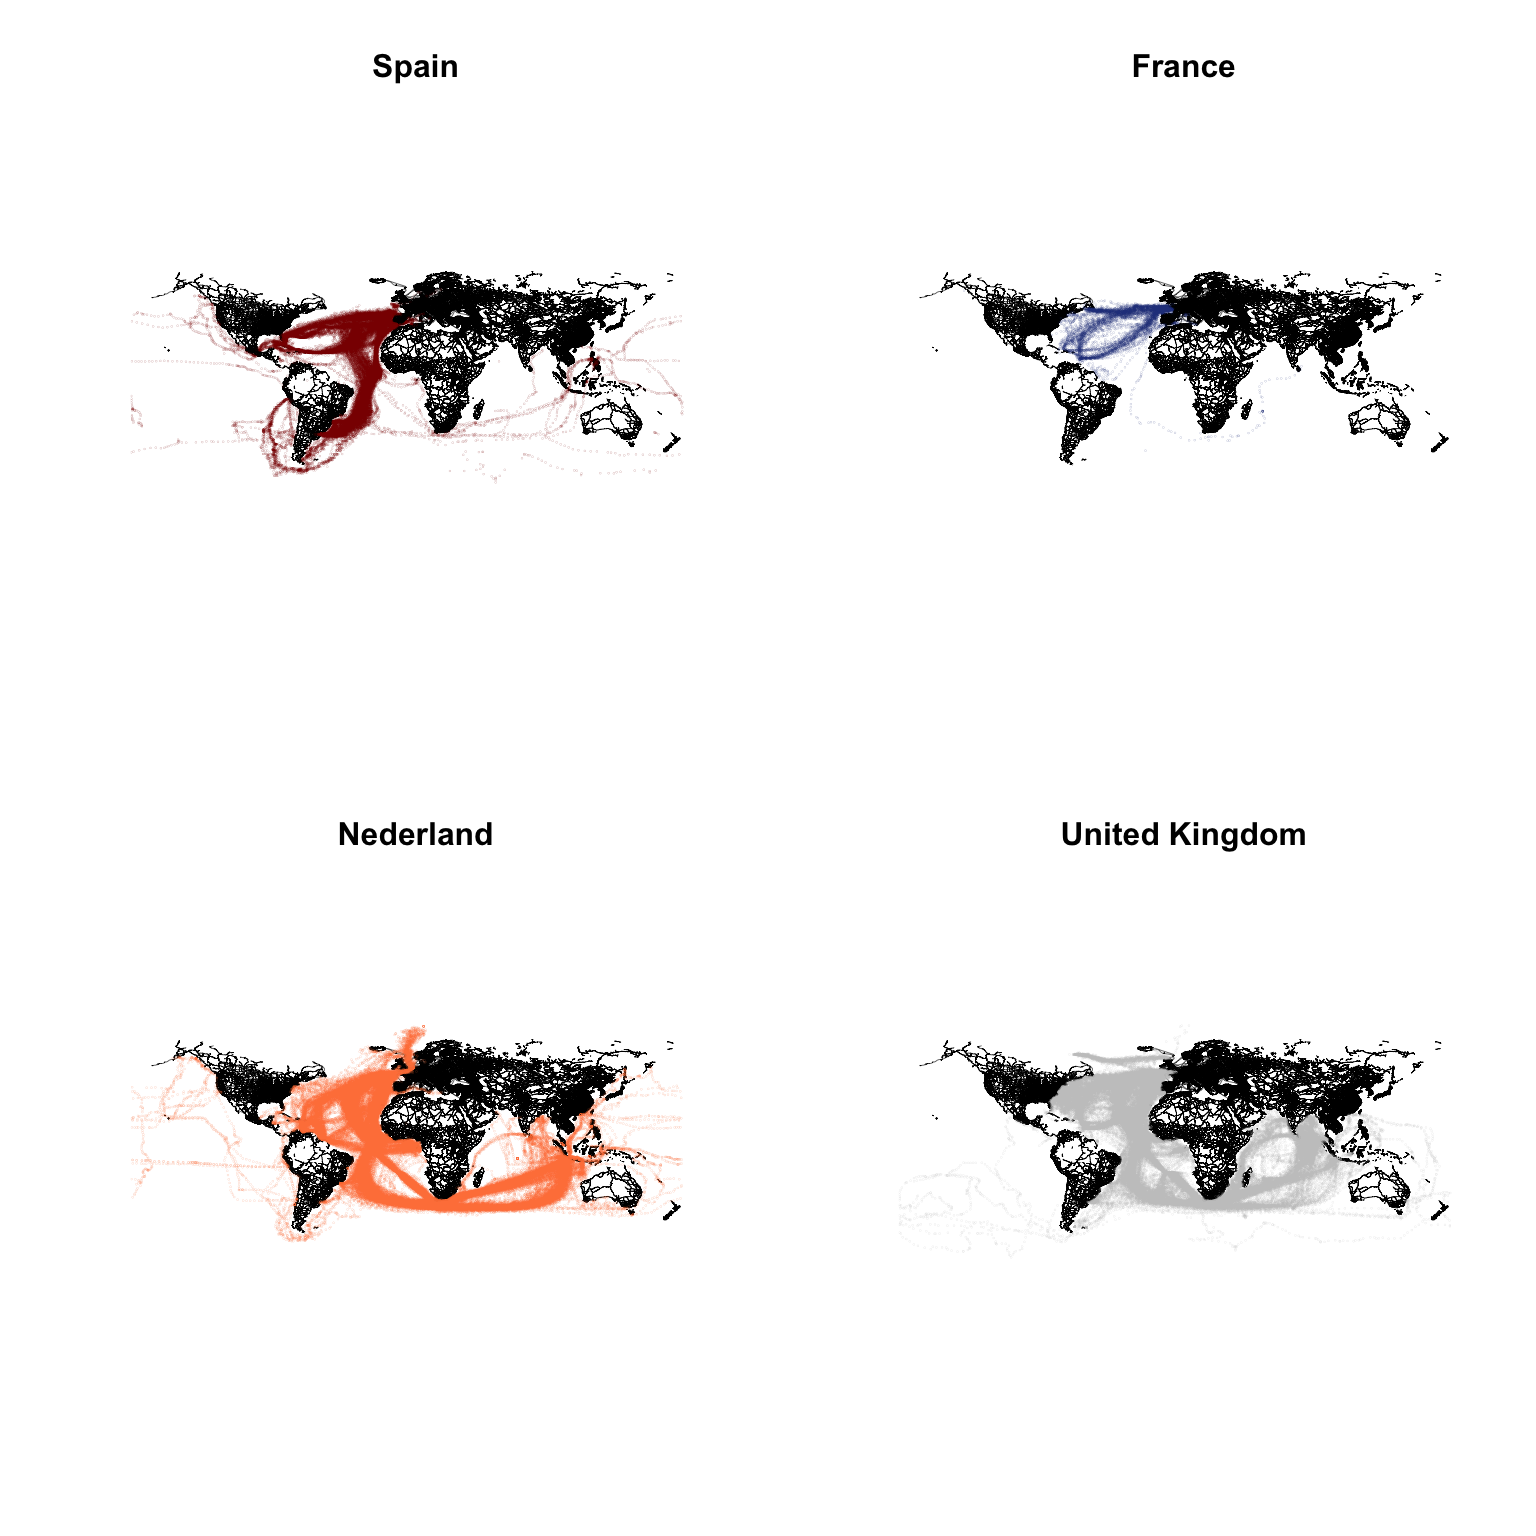
This resulting panel gives a little more information about where certain Nations were shipping to and from in the 1750’s to 1855. This data will be a lot more fun once I start delving into the full dataset but I thought it deserved another project.
The practical uses of multiple R plots has been illustrated by R-Bloggers. I have used it many times in my job to present a snapshot of data in a dashboard style format which is very popular now in the corporate world. This image below was an example of this with multiple charts types, found on the aforementioned R-Bloggers website.