Written on
A quick look at Bechdel test data (& an awtools update)
Found in [R , awtools , Bechdel Test] by @awhstin on
A good visualization always grabs my attention and draws me into articles. I am an avid follower of the Washington Post, New York Times, The Economist and a host of other websites/publications that are doing their fair share of data driven journalism. A couple weeks ago I came across a this article, Men, women, and films from 1843 Magazine which is the Economist’s lifestyle magazine. The article drew me in with the tagline “how pronounced is the gender divide on the silver screen”.
Click the link and you will see an exciting radial style plot that shows the roles in films by gender and importance. One of the first things that jumps out at me is the Age of Peak Prominence, which shows the age at which most roles are had by the genders in a sample of 937 films. Men had 71% of the roles and a peak prominence age of 40 whereas women had 29% of the roles and a peak prominence age of 32. Other interesting pieces were the movies they specifically cite like Coraline and Aron being the most important roles by gender. Thinking back to both of those movies they both seem very isolated characters and are somewhat interesting to compare.
This sort of visualization along with the interesting article always piques my curiosity and the best part after finishing is seeing the Sources section. This allows users like you and I to grab and see some of the data for ourselves and make our own conclusions about it. So when I saw BechdelTest.com I decided to have a go with their API. The Bechdel test originated from a comic book that then, in the early 2000s, gained popularity with a number of analyses done by various places like this one from FiveThirtyEight.
Below are the parameters for the Bechdel test
Rules
- It has to have at least two [named] women in it
- Who talk to each other
- About something besides a man
Though I was very intrigued by this data the reason for the post is two-fold. Before we begin I wanted to briefly introduce my personal theme and tools package, awtools, which I use personally at work and as the main theme on this website. Originally I had created a minal and distilled theme, a_theme, that used my main website font Slabo 27px and PT Sans Narrow. That is still included but recently I went full Roboto and now my title fonts are Roboto Slab and Roboto Light for the body. Since that change I wanted to include a few other aesthetic changes in the awtools package as well, feel free to visit the github page to view all the changes.
library(tidyverse)
library(awtools) #devtools::install_github('awhstin/awtools')
The Bechdel Test API documentation is pretty straightforward so we can use their getAllMovies method to grab the full dataset to play with. They do request however that you do not frequently call it but instead cache or save the data locally.
#grab data from the API
#you'll need the jsonlite package if you don't already have it
#the website requests that you don't use the getAllMovies method so cache it for later use!
movies<-json_lite::read_json('http://bechdeltest.com/api/v1/getAllMovies',simplifyVector = TRUE)%>%
  data.frame()%>%
  mutate(year=as.numeric(year),
         id=as.numeric(id))
What have we got to work with? I decided to look up a recent favorite movie of mine to see.
#inspect it
moana<-movies%>%
  filter(title=='Moana')%>%
  as.tibble()%>%
  print()
## # A tibble: 1 x 5
## title year imdbid rating id
## <chr> <int> <chr> <chr> <int>
## 1 Moana 2016 3521164 3 7292Great, now we can look into the dataset as a whole.
#films passing the bechdel test every year
movies.trim<-movies%>%filter(year>=1967)
ggplot(movies.trim,aes(x=year))+
geom_point(stat='count',aes(color=rating))+
geom_line(stat='count',aes(color=rating))+
a_robot_theme()+
a_step_color()+
theme(legend.position = 'right')+
labs(title='Bechdel test scores over the years',
subtitle='Count of Bechdel test film scores since 1967.',
caption="Data from http://bechdeltest.com")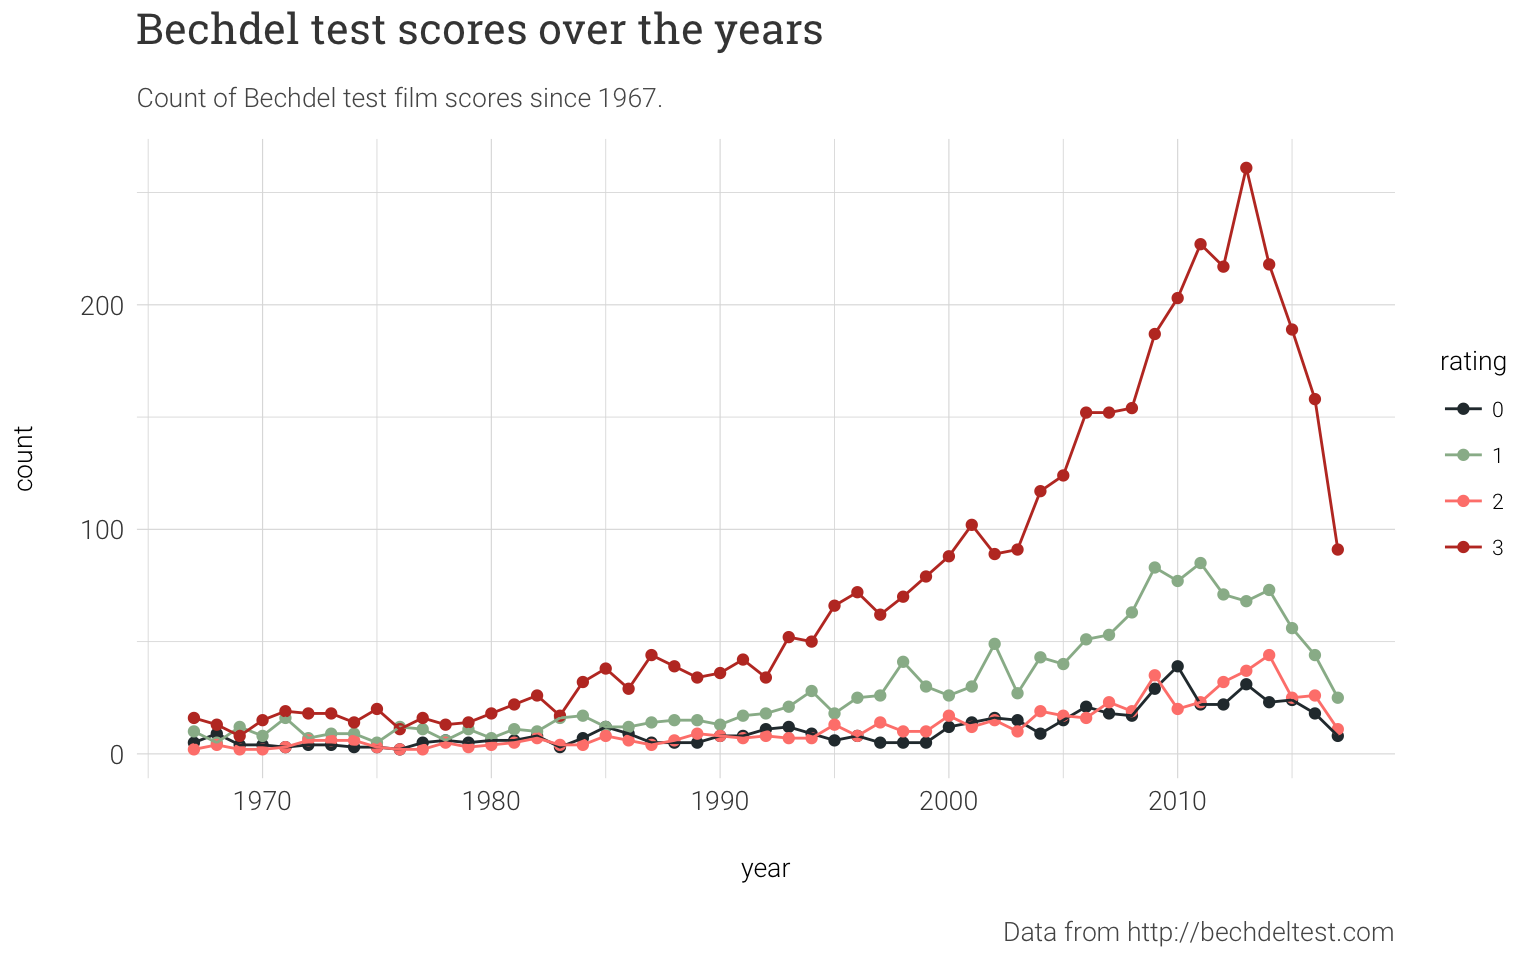 It looks like the number of ‘passing’ movies has steadily been increasing. There is data available on the website that shows how active users are in submitting movies, for reference 47 movies were added in November alone. One has to wonder if that uptick is representative of the the actual trend in movies, or it could be biased by what contributors watch and evaluate. In most of the articles I have cited they look at IMDB data to compare revenue, titlular characters and more. I originally looked into getting IMDB data from the
 omdbapi package, which apparently needs a key now, and as I started to look forward I sort of lost interest in the idea. It was going to be another half written R Markdown file (I have many). I thankfully remembered, and since I was not planning on going in too deep, that ggplot2 used to have a movies dataset that is now its own package, ggplot2movies. That may have something for us! There is no id field but I think we could just join on the film titles. With that done something that jumps out at me right away is looking at the average IMDB rating year by year for each of the test levels.
#bechdel and rating
ratings<-ggplot2movies::movies
movies.with.rating<-left_join(movies.trim,ratings,by='title')%>%
filter(!is.na(votes))
#average IMDB rating by test score
avg.test.rate<-movies.with.rating%>%
group_by(year.x,rating.x)%>%
summarise(imdb=mean(rating.y),n=n())%>%
filter(year.x>=1967)
ggplot(avg.test.rate,aes(x=year.x,y=imdb,color=rating.x))+
geom_point(alpha=.35)+
geom_smooth(se=F)+
a_robot_theme()+
a_step_color()+
labs(subtitle='Average user IMDB rating by year and test score')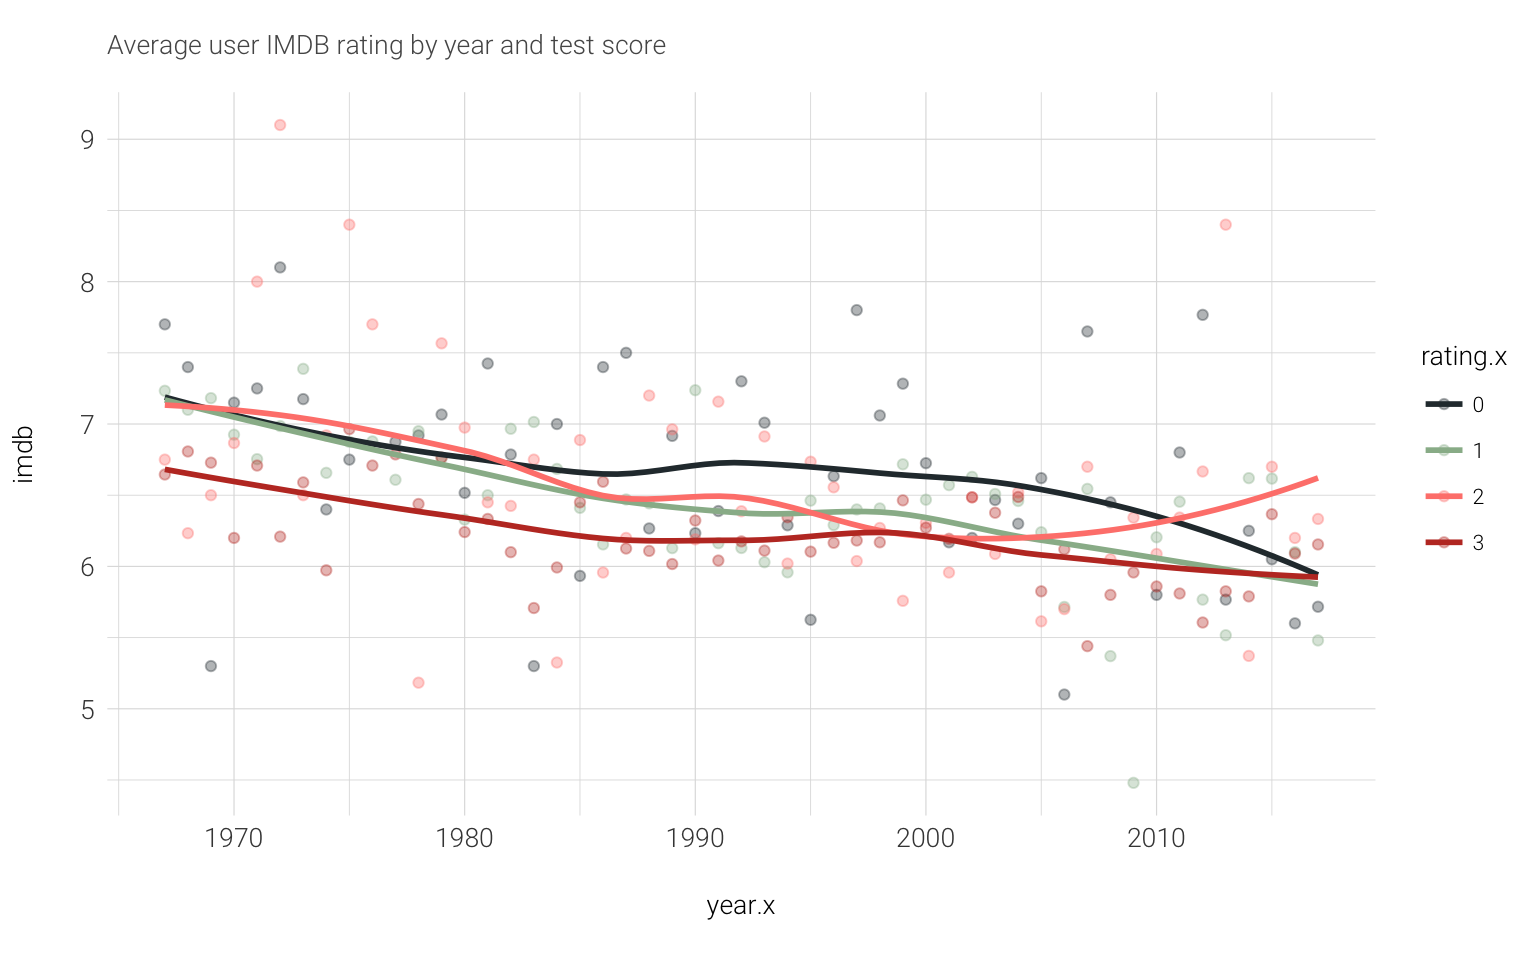 It seems to be that the average rating is going down overall, does that mean people over time are getting more strict in rating? There is an interesting trend upward for movies with a score of 2, what is interesting about those? Within the
 movies.with.rating dataframe we have the genre of the movie. It could be interesting to look into those as there may be trends within the genres themselves that indicate general score improvements over the last few years.
#average IMDB and test score by genre
genres<-movies.with.rating%>%
group_by(rating.x)%>%
gather(genre,gys,22:28)%>%
filter(gys>0)
genre.rate<-genres%>%
group_by(year.x,genre,rating.x)%>%
summarise(imdb=mean(rating.y),n=n())
ggplot(genre.rate,aes(x=year.x,y=n,color=rating.x))+
geom_point(alpha=.30)+
geom_smooth(se=F)+
facet_wrap(~genre,ncol = 1,scales='free_y')+
a_robot_theme()+
a_step_color()+
labs(subtitle='Bechdel test spread of movies by genre over the years')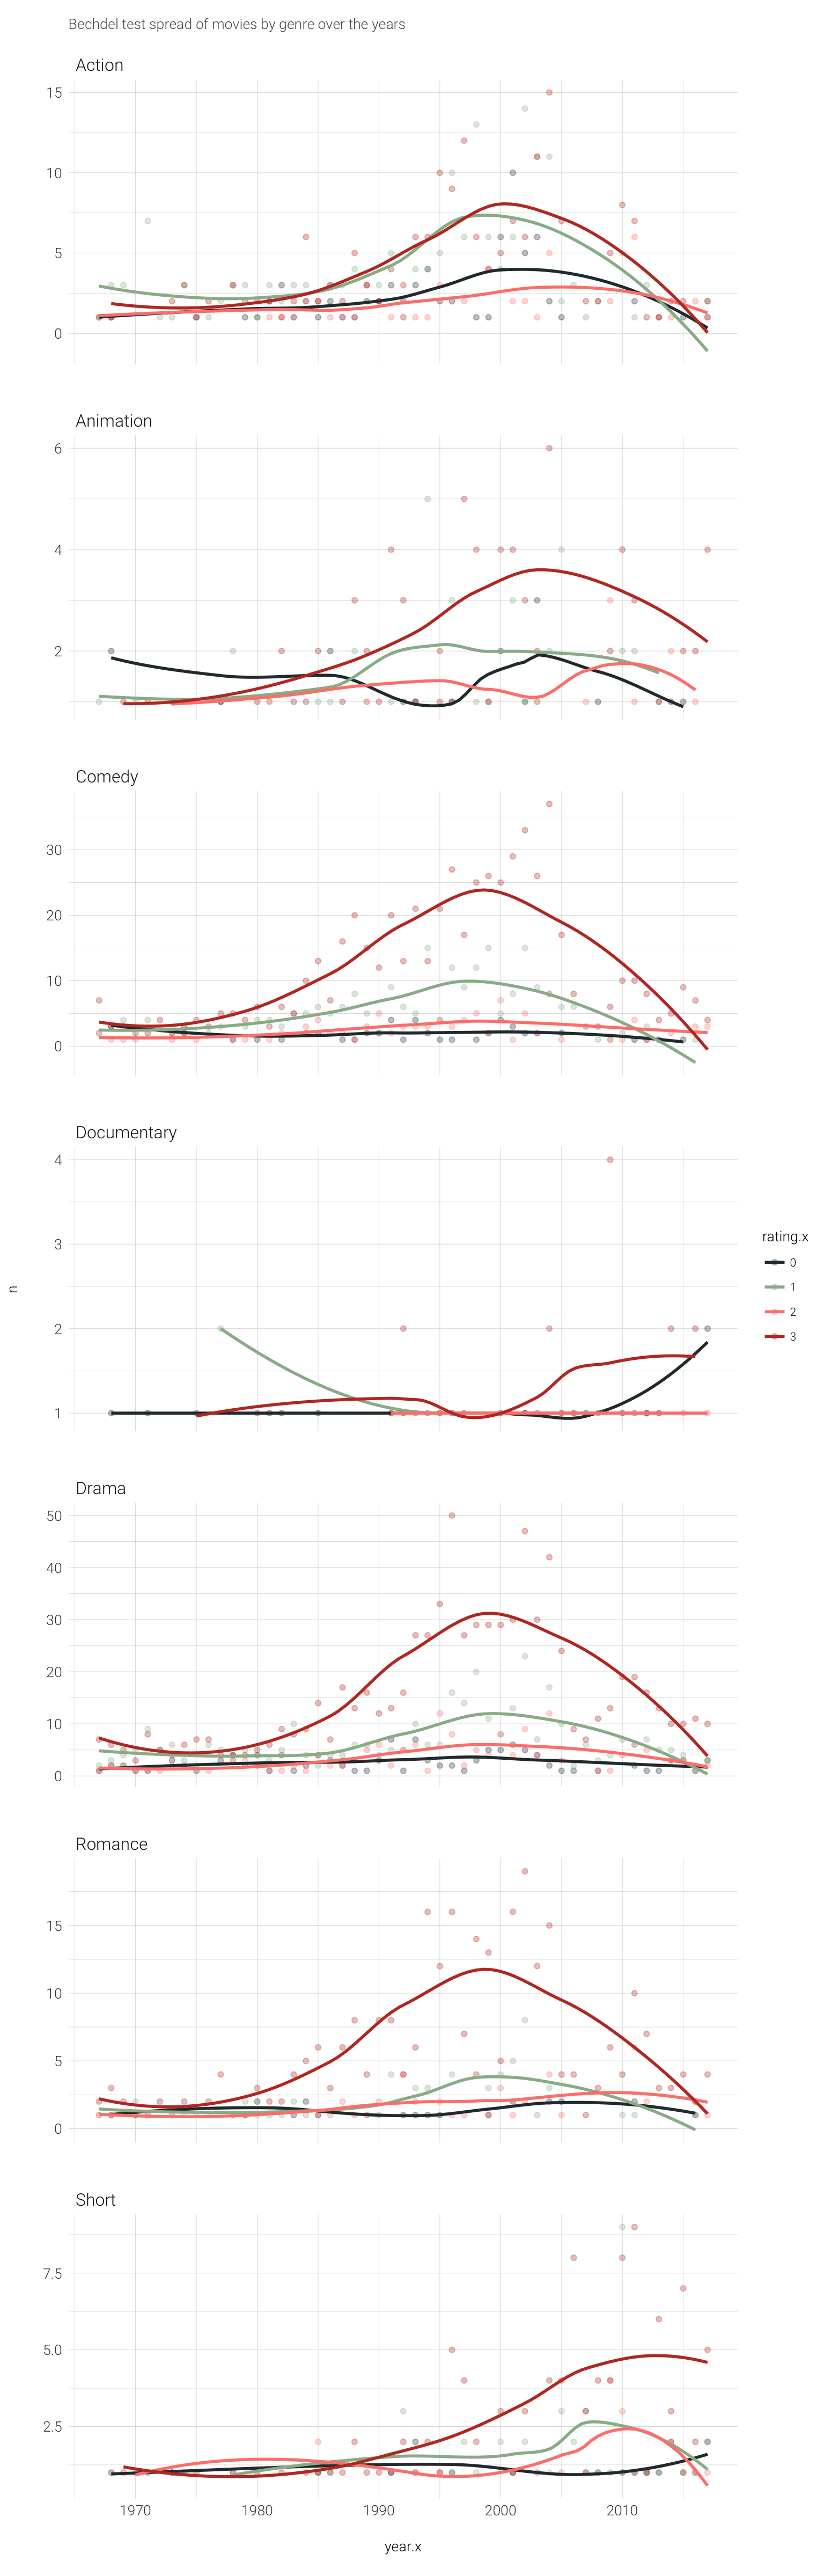 It was interesting to see the uptick in all genres of movies passing the test in the last 10 years or so. Though there is so much more I would like to do I really enjoyed looking into this data as well as using it to debut some of
 awtools new features. This look into the genres is a glimpse at best and the test as a whole does not tell the whole story. There are good movies that don’t pass the Bechdel test and bad movies that do. As I was very briefly doing research on this dataset and Bechdel tests in general I came across this quote from the FiveThirtyEight article mentioned above and I like the thought around it.
“The Bechdel test isn’t measuring whether a film is a model of gender equality. It doesn’t certify that movie is “good” when it comes to integrating women. And passing it doesn’t mean that female characters are well written, play crucial roles in the plot or display meaningful depth of character. But it’s the best test on gender equity in film we have — and, perhaps more important for our purposes, the only test we have data on.”
Walt Hickey - The Dollar-And-Cents Case Against Hollywood’s Exclusion of Women
If you have suggestions of other datasets that could add to this or if you believe I did some terribly wrong let me know or overlooked something please let me know.