Written on
Movers & Shakers: trying to make sense of Fantasy Premier League data
Found in [R , data visualization , soccer] by @awhstin on
For the past couple years now I have been participating and comissioning numerous Fantasy Premier Leagues. These leagues have often manifested across multiple sites like Fantrax or the Fantasy Premier League and they all tend to have different ways of suggesting what players a user should pick for their team. Most present last year’s stats, this year’s or average points per game week but these are all summary stats which got me thinking. What if we look at fantasy points for players across the current season? Maybe if we do some simple regression we can get a little more out of the data than just at the high level?
Luckily there is data out there that can help us with this. I stumbled upon the Fantasy Premier League on Github and decided to take a look. There is a data folder that has different seasons available so since I want to look at the current season that is what we will focus on. With a small loop (sure a loop!) we can get all the data into a single dataframe.
tl;dr: there is a player table at the very bottom of the page
library(tidyverse)
library(awtools)
library(ggbeeswarm)

#data
pattern<-'https://raw.githubusercontent.com/vaastav/Fantasy-Premier-League/master/data/2019-20/gws/gw'

urls <- data.frame(gw=1:26,url=paste0(pattern,1:26,'.csv'),stringsAsFactors = FALSE)
gws <- NULL
i=1
for(i in 1:nrow(urls)){
  temp<-read.csv(urls$url[i])
  gws <- gws %>%
    rbind(.,temp)
}
Cool. Now that we have that we can inspect the data and try to find some interesting trends. Upon first look there is clearly a lot of data to look at, let’s save that for another day. There is a total_points variable that I am most interested in. We will keep that and then clean up the names, then plot a few players I am familiar with to see how it looks.
#clean data
gws_clean <- gws %>%
  select(1,20,26) %>%
  mutate(name=parse_character(gsub('_',' ',name))) %>%
  mutate(name=str_trim(gsub('[0-9]+','',name)))

#look at the raw data for a couple players we know
gws_clean %>%
  filter(name %in% c('Marcus Rashford','Kevin De Bruyne','Jack Grealish')) %>%
  ggplot(.,aes(x=round,y=total_points)) +
  geom_bar(stat = 'identity') +
  a_plex_theme() +
  facet_wrap(~name,ncol=3)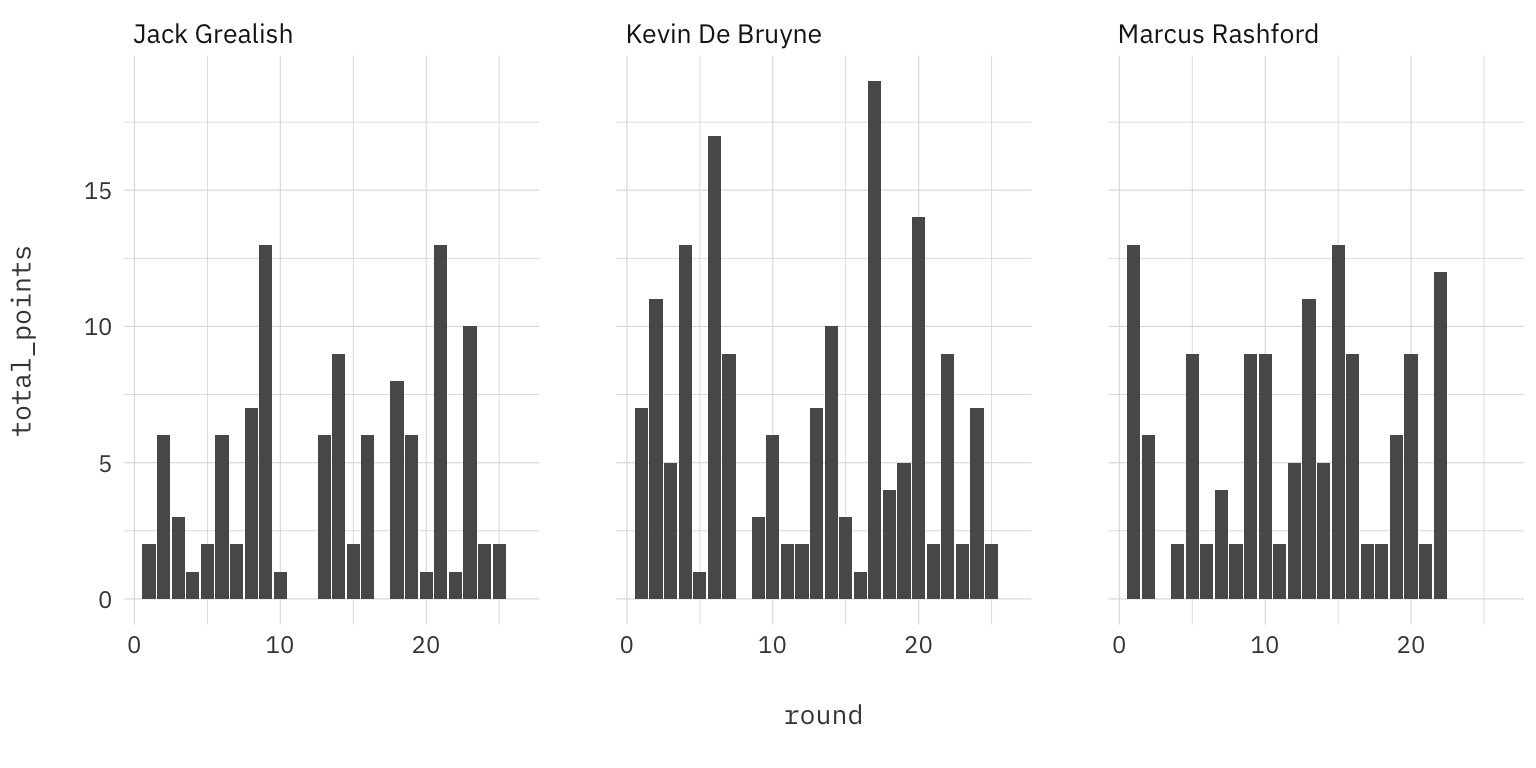
Great! That is what I expected. All these players have some great games and are generally good gets as far as fantasy points are concerned. The overall points might tell us that these three players are great to have on your team but the overall points does not capture the full picture.
gws_mod <- gws_clean %>%
  group_by(name) %>%
  do(model=lm(total_points~round, data=.)) %>%
  mutate(slope=model$coefficients[2]) %>%
  ungroup()

#then make that slope prettier

gws_mod <- gws_mod %>%
  select(c(-2)) %>%
  mutate(type = case_when(
    slope >= 0.05  ~ 'Steeply Rising',
    slope > 0.01 & slope <=.05 ~ 'Moderately Rising',
    slope >= -0.01 &  slope <=.01 ~ 'Flat',
    slope < -0.01 & slope >=-.05 ~ 'Moderately Falling',
    slope <=-0.05 ~ 'Steeply Falling',
    TRUE ~ "Other"
  )) %>%
  mutate(type=factor(type,levels = c('Steeply Rising','Moderately Rising','Flat','Moderately Falling','Steeply Falling','Other')))
Once those groups are put together I think we need to take a look and get a sense of where the players shake out. First we can look at just the total number of players in each group and secondly we can include some average stats to see what types of players are falling into what group. In my mind these are the types of players the groups represent:
- Steeply Rising/Moderately Rising: these players are either players who have started playing more minutes or their form has changed and they have seen a steady rise in fantasy points earned.
- Flat: though this name might be disingenuous this group is a group that doesn’t fluctuate points per week much but offers a consistent amount of points.
- Steeply Falling/Moderately Falling: this group is made up of players who were playing well and have seen their form dip whether because of injuries or new players coming in the transfer window. This group also consists of players who might have been scoring a lot of points and have seen a small dip in points.
#look at the groups
gws_mod %>%
  group_by(type) %>%
  tally() %>%
  ggplot(.,aes(x=type,y=n)) +
  geom_bar(stat='identity') +
  a_plex_theme()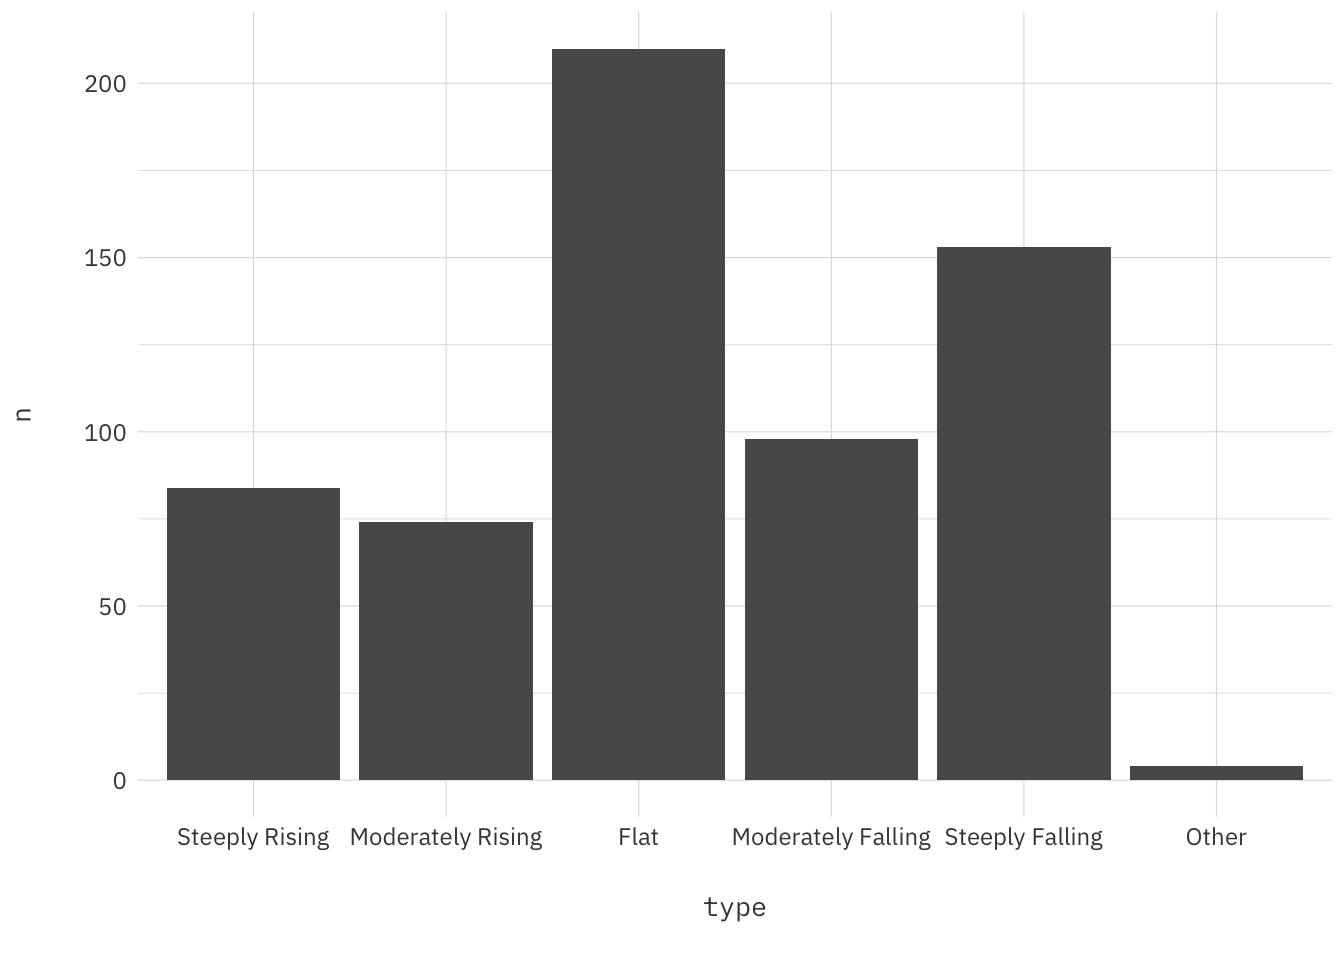
gws_summary<- gws_clean %>%
  group_by(name) %>%
  summarise(avg=mean(total_points),
            total=sum(total_points))

#by point range?
gws_mod %>%
  left_join(.,gws_summary) %>%
  filter(total > 0) %>%
  ggplot(.,aes(x=type,y=avg, color=type)) +
  geom_quasirandom(aes(alpha=log(avg)),show.legend = FALSE) +
  a_primary_color() +
  a_plex_theme() +
  labs(y='Average Pts',x='')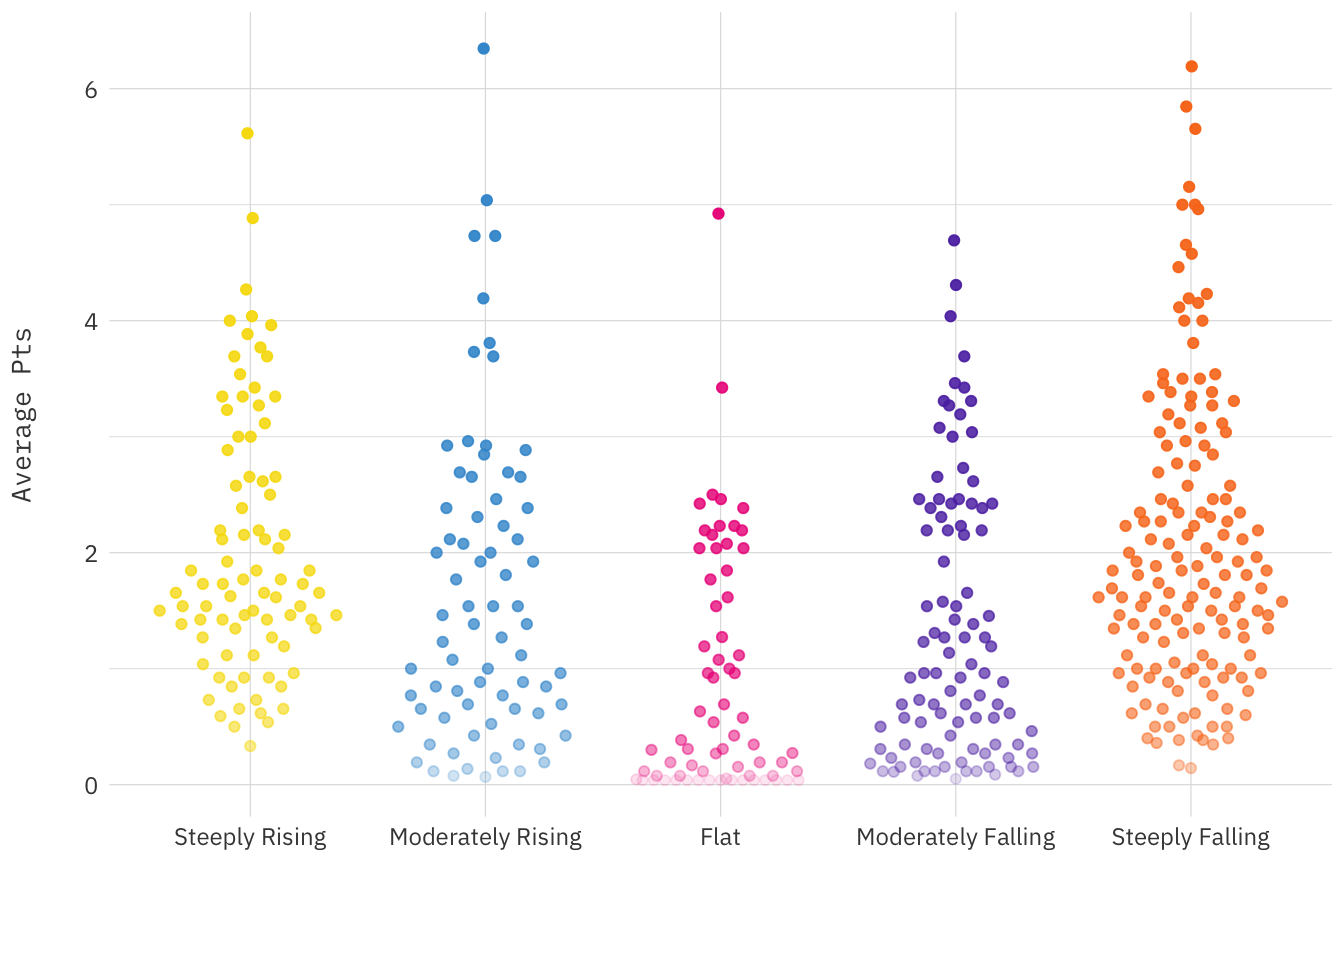
I think this points a more well rounded picture of the players in each group. Would you want to pick up a player who maybe has 200+ points but that data coupled with a Steeply Falling trend seems to point to a slump when maybe a player with less points overall but a Steeply Rising trend and a normal starter for their squad might have a greater upside? This was an immensely fun exercise in trying to get a look behind the curtain of Fantasy Premier League stats and test some notions I anecdotally held. I believe the utility in this sort of exercise is to be able to see the general trend of a player’s performances that are masked by the overall points they have scored. Secondly this could provide a useful tool in building fantasy teams or helping to assess what players to include in your current team. To that end I have provided a searchable table at the bottom of the page where you can search for players.
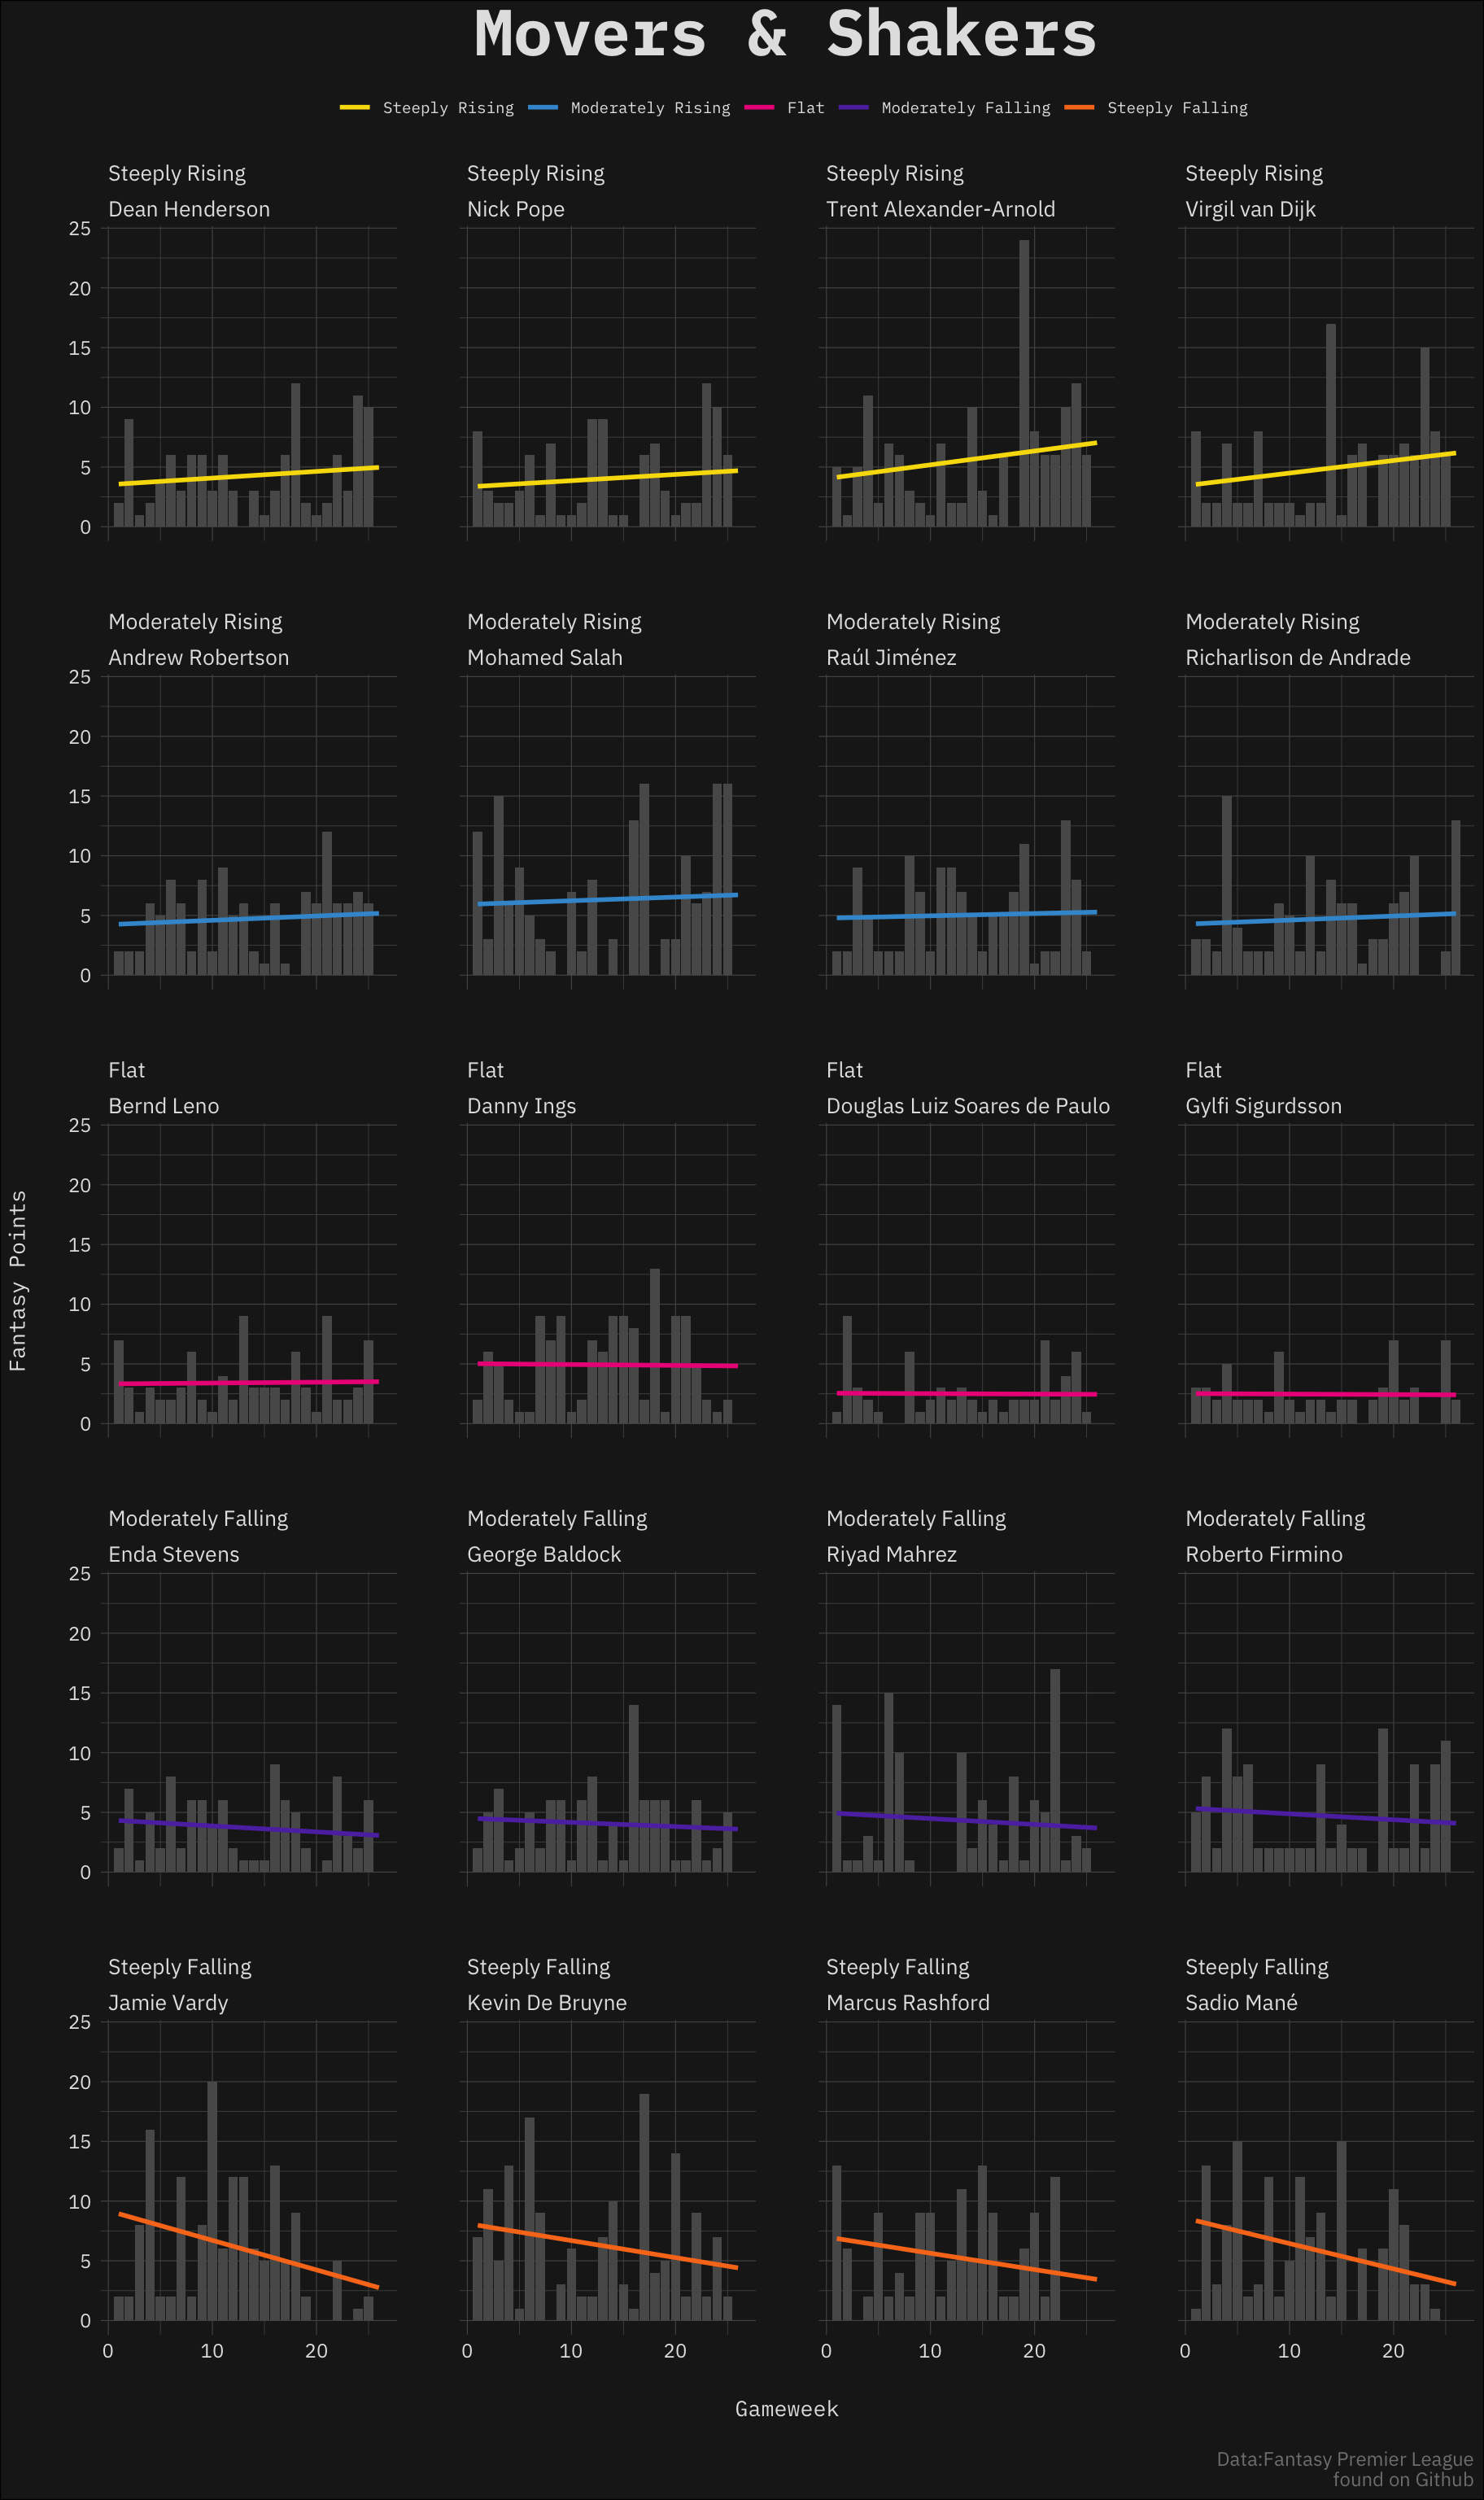
Below is a poster style visualization I decided to make with this data. It includes the top 4 players by points total for each type of trend. Players like Trent Alexander-Arnold and Virgil Van Dijk in the Steeply Rising group make a lot of sense. The players in the Flat category are intriguing. This is not necessarily saying they are not playing well or not earning lots of points what it is saying is that their points are consistent. Those who have participated in Fantasy leagues before will realize this group is highly important to fill your team out with highly consistent players. Finally in the Steeply Falling group is not really surprising at all. Jamie Vardy has struggled to get involved and find the back of the net recently after a flying start to the season and Marcus Rashford also was struggling for goals before he went out injured.
Player Table
This is a table of all calculated values from this post