Written on
Friday Fun: Comparing annual ACS data with tidycensus
Found in [Illinois , mortgage , awtools] by @awhstin on
At the time of writing this I have been mired in one of life’s most confusing and convoluted processes, buying a house. After constantly being fed numbers, stats, and figures all of which had Comic Sans as a font, I decided to find out some information for myself. Doing that greatly helped inform me about the buying process and actually empowered me to speak to the various powers at be (and there are a lot of them) with a little more knowledge. Now I am a little further into the process and I find myself wanting to learn a little more about mortgages, and mortgaged houses, in Illinois in general. Naturally my focus turned to the tidycensus package, which is another one of my favorite packages to work with.
before we start…
- For some great tutorials, use cases and support for the
tidycensuspackage visit Kyle Walker’s tidycensus website. - Also give him a follow on Twitter @kyle_e_walker.
- You must get a Census API key before we start, go to http://api.census.gov/data/key_signup.html
library(tidyverse)
library(tidycensus)
library(awtools) #only for the theme, colors etc

#startup
census_api_key("Your Key Here Please")
This API is full of amazing data and (for me) it can be hard to find exactly the data you are looking for. I have developed a sort of system for searching the variables by keywords when I don’t know exactly the tables I am looking for. It is by no means perfect but works for me. In this case I want to look for variables that have to do with mortgage so naturally I used that as a keyword.
#find var
v15 <- load_variables(2016, "acs1", cache = TRUE)
variables.list<-v15[grep("mortgage", v15$label), ]
This makes things much more manageable. From there I use it to look for the variables I know I want. In this case the actual variables we want are to look at high level values for houses with, and without mortgages for the last few years which is variable B25097. Normally the get_acs function uses 2016 as the default year and would pull the most recent data or a single year’s data. To get all the years of data we have to do a little extra using the map_df function. In my version I want to look at Cook County specifically.
#IL stuff
#first look at total value etc
acsyears<-2010:2016
il.value<-map_df(acsyears, function(x) {
  get_acs(geography = "county",
                  year=x,
                  variables = c('B25097_002E','B25097_003E'),
                  state='IL',
                  county='Cook')}%>%
    mutate(year=x))
Now that all the data is together I want to join the variables and labels from the variables.list and then make a pretty label for plotting.
il.value<-il.value%>%
  mutate(name=paste0(variable,'E'))%>%
  left_join(variables.list)%>%
  mutate(type=ifelse(name == 'B25097_002E','With Mortgage','Without Mortgage'))
Now we will plot the data. One thing to note is the use of a_concert_theme and abs_comma, both of which are purely formatting and aesthetic edits that you do not need to include. If you are interested in using my theme and some of its functions, or want to tweak it and use it for yourself you can find that on github in my awtools repo.
#films passing the bechdel test every year
ggplot(il.value,aes(x=year,y=estimate,color=type))+
geom_line()+
geom_point(alpha=.33)+
a_concert_theme()+
scale_y_continuous(name='Dollars',labels = abs_comma)+
labs(title='IL Mortgage Values',
subtitle='ACS median mortgage values by year for Cook County, IL')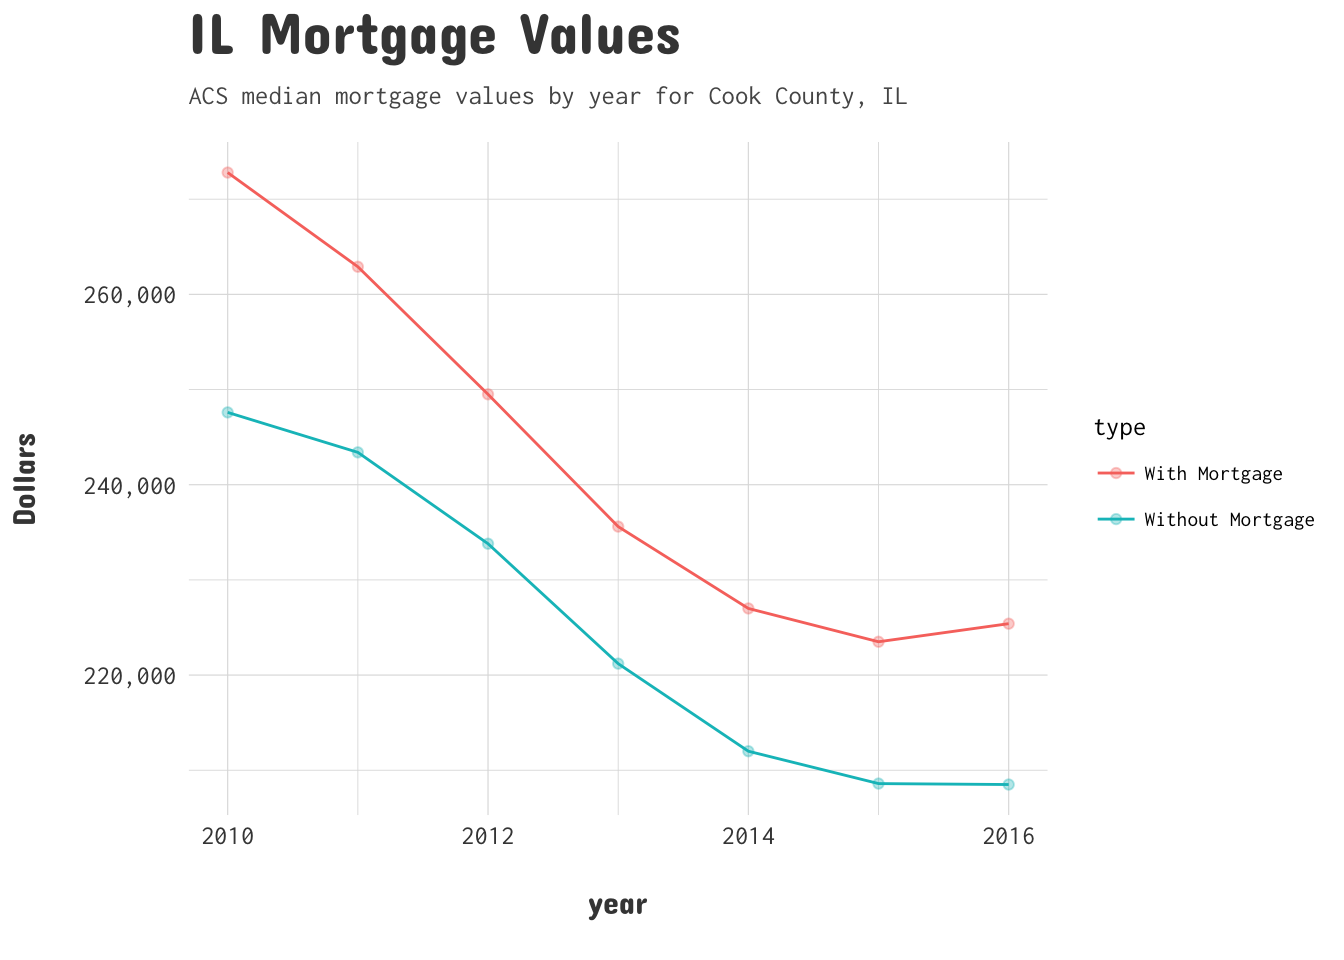 This trend is interesting but maybe not surprising. The slight increase from 2015 to 2016 in the ‘With Mortgage’ group is interesting and I want to look more into that. First I revisited the
 variables.list dataframe and found B25096 which has to do with the number of homes with a mortgage in a price range. Using the same logic as before but adding a piece of logic with paste0 that pulls the individuals variables we can collect all the data for the ‘With Mortgage’ group for these years.
#Interesting, I want to focus on the group with a mortgage.
#specific home value numbers
il.mortgages<-map_df(acsyears, function(x) {
  get_acs(geography = "county",
          year=x,
          variables = c(paste0('B25096_00',3:9,'E')),
          state='IL',
          county='Cook')}%>%
    mutate(year=x))

ill.mortgages<-il.mortgages%>%
  mutate(name=paste0(variable,'E'))%>%
  left_join(variables.list)%>%
  mutate(type=unlist(lapply(strsplit(label,'!!'),'[',4)))
Once we gathered the data and cleaned it similar to the first time we can take a look at how the trends look in the plot. I would imagine that the lower to mid range mortgage price levels will have risen in the last couple years of the survey. I imagine this is because people’s aversion to getting a mortgage, fairer rates, and general stability have raised people’s interest.
#look
ggplot(ill.mortgages,aes(x=year,y=estimate,color=type))+
geom_line()+
geom_point(alpha=.3)+
a_concert_theme()+
a_primary_color()+
scale_y_continuous(labels = abs_comma)+
labs(title='You get a mortgage & you get a mortgage',
subtitle='Housing units by mortgage value range for Cook County, IL',
caption='Data from ACS years 2010-2016')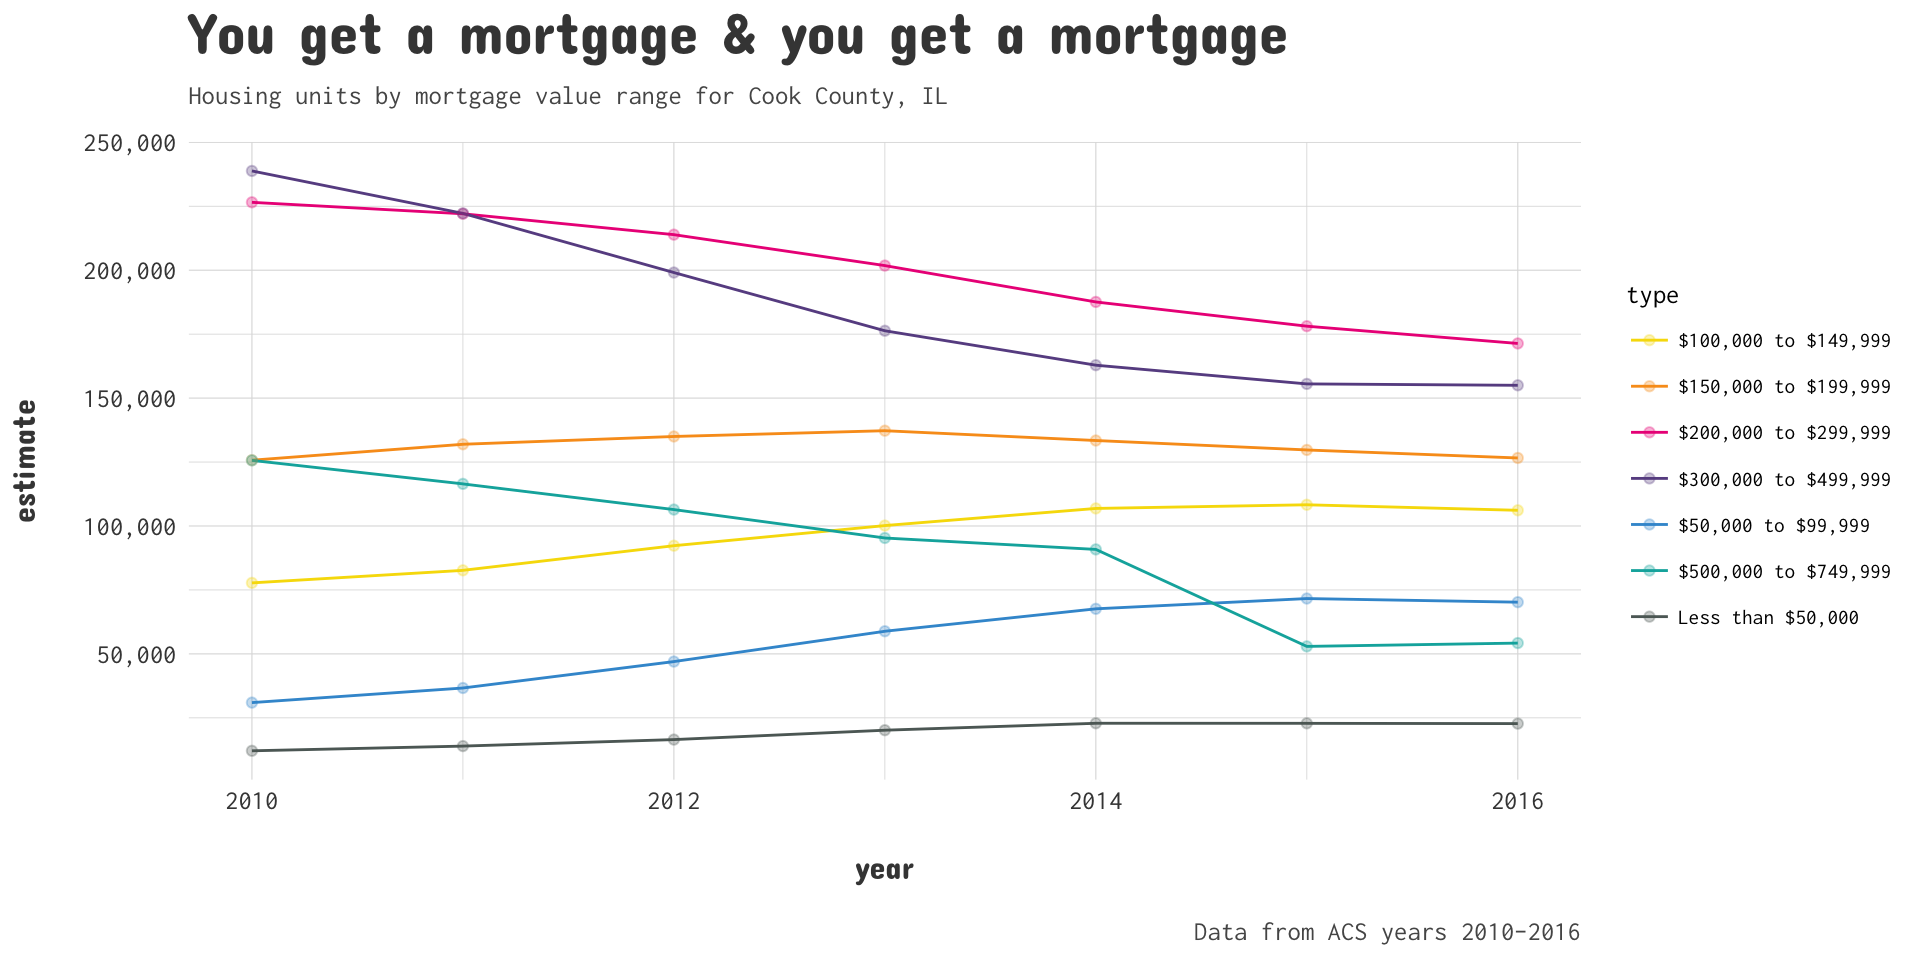 Much like I thought it seems that the mortgage trends are generally rising for the lower third of the price ranges. Mortgages over $200k all seem to be trending negatively but there could be other reasons for that. The ACS reported substantial decreases in response rates could also be to blame for some of the negative trend in the data. Though knowing that makes the trend of lower priced mortgages upwards all the more interesting. Another reason for these trends could be that there is a general move out of the downtown Chicago towards the suburbs where it is more common to find lower priced houses.