It is not often that I write about work on here. Usually it is a proving ground of concepts that I am usually trying to integrate into my work and I need to try them out. I decided to change that a little and write a tutorial on something I have found extremely useful in my work as a data scientist for nonprofits. Traditionally, being that the data we deal with is so highly sensitive, it is impossible to really share work or visualizations that are not macro-level so online tutorials for things involving nonprofits usually need some sort of scrubbed or anonymized data.
That is where this tutorial comes in to play. I started creating my own personal data generating donors and giving tables to share dashboards, visualizations and what have you with others or external companes. Having a generated list of donors and gifts allows you to test products or demonstrate concepts and explain issues without revealing any sensitive data.If you find yourself here and R is not necessary something you want to try or learn you can visit my Github page where I have uploaded an iteration of the resulting giving table for you to use.
Sample gift table
Generating the data
I originally came at the problem by starting with a table of made up donors. There are a lot of lists on the internet with years of baby names, or popular names you can sample from. I have a list of boys and girls names on my Github that I will use for this. Once those are in we can combine the two into a long list, and then sample those for as many donors as we like. I will start with 10000.
library(tidyverse)

#name data
boys<-read.csv('https://raw.githubusercontent.com/awhstin/Dataset-List/master/boysnames.csv',stringsAsFactors = FALSE)
girls<-read.csv('https://raw.githubusercontent.com/awhstin/Dataset-List/master/girlsnames.csv',stringsAsFactors = FALSE)

names<- c(boys$name, girls$name)

donors <- data.frame(
  name = sample(names, 10000, replace = TRUE),
  alpha = sample(names, 10000, replace = TRUE)) %>%
  mutate(id = 1:nrow(.))

#test names
length(unique(paste(donors$name, donors$alpha)))
## [1] 9995So it looks like it gives us nearly 10000 unique names which forms the donor table that we will join all our gifts to. To generate the gifts we will create gift types, which I decided on using some of the more well-known types of gifts, and created a second type that is for the smaller gifts. This is an optional step depending on your intended use but I wanted to demonstrate the technique one could use to add attributes and categories to this data. Then I join all the gifts into a data frame, which we can then view the gift distributions.
A couple points that can be changed would be the dates. The code below generates gifts between 1/1/2008 to 12/31/2018, and generates gift amounts by a very rudimentary range of big, medium and small gifts all of which you could adjust. Let me walk through the specific parts:
- First we generate the id(1:10000) and we will use this to join the data back to the donors
- Next we use
sample_nto grab 30 of those generated, these will be our big donor’s gifts - Then we use
sampleliberally to generate the gift amount, type (from our list), and arbitrary dates
Once you have that formula you can expand to the medium and smaller gift. Finally once the big, medium, and small gifts are made then we bind everything together then join it back to our donors to create the gifttable.
types<-c('Cash', 'Pledge', 'Stock',  'Recurring Gift')
small.types<-c('Cash', 'Stock', 'Recurring Gift')

big.gifts<- data_frame(id=1:10000) %>%
  sample_n(., 50, replace=TRUE) %>%
  mutate(
    amount = sample(5*10^6, nrow(.), replace = TRUE),
    type = sample(types, nrow(.), replace=TRUE),
    date = sample(seq(as.Date('2008/01/01'), as.Date('2018/12/31'), by="day"), nrow(.),replace=T),
    origin = 'big')

medium.gifts<- data_frame(id=sample(1:10000)) %>%
  sample_n(., 5000, replace=TRUE) %>%
  mutate(
    amount = round(sample(100000, nrow(.), replace = TRUE), digits=0),
    type = sample(types, nrow(.), replace=TRUE),
    date = sample(seq(as.Date('2008/01/01'), as.Date('2018/12/31'), by="day"), nrow(.),replace=T),
    origin = 'medium')

small.gifts<- data_frame(id=1:10000) %>%
  sample_n(., 20000, replace=TRUE) %>%
  mutate(
    amount = round(sample(5000, nrow(.), replace = TRUE), digits=2),
    type = sample(small.types, nrow(.), replace=TRUE),
    date = sample(seq(as.Date('2008/01/01'), as.Date('2018/12/31'), by="day"), nrow(.),replace=T),
    origin = 'small')

all.gifts <- big.gifts %>%
  bind_rows(small.gifts) %>%
  bind_rows(medium.gifts)

gifttable <- donors %>%
  left_join(., all.gifts, by='id') %>%
  mutate(full = paste(name, alpha),
         fy=format(date,'%Y'))

#write.csv(gifttable,'gifttable.csv', row.names = =FALSE)
Now that we have the table built let’s take a look at the sum of those gifts we just generated across the years. This will help us see the distribution of gifts in the years we provided. Commented out is an option to write your newly created data to a csv file to play with in other programs.
sums<- gifttable %>%
  group_by(fy,origin) %>%
  summarize(n=n(), sum=sum(amount)) %>%
  filter(!is.na(origin))

ggplot(sums,aes(x=fy, y=sum, fill=origin, group=origin)) +
  geom_col(position = 'stack') +
  a_plex_theme() +
  a_gray_fill() +
  scale_y_continuous(labels=scales::dollar) +
  labs(
    title='Gift totals by year',
    caption='Sum of generated gifts by class\n for years in date range.'
  )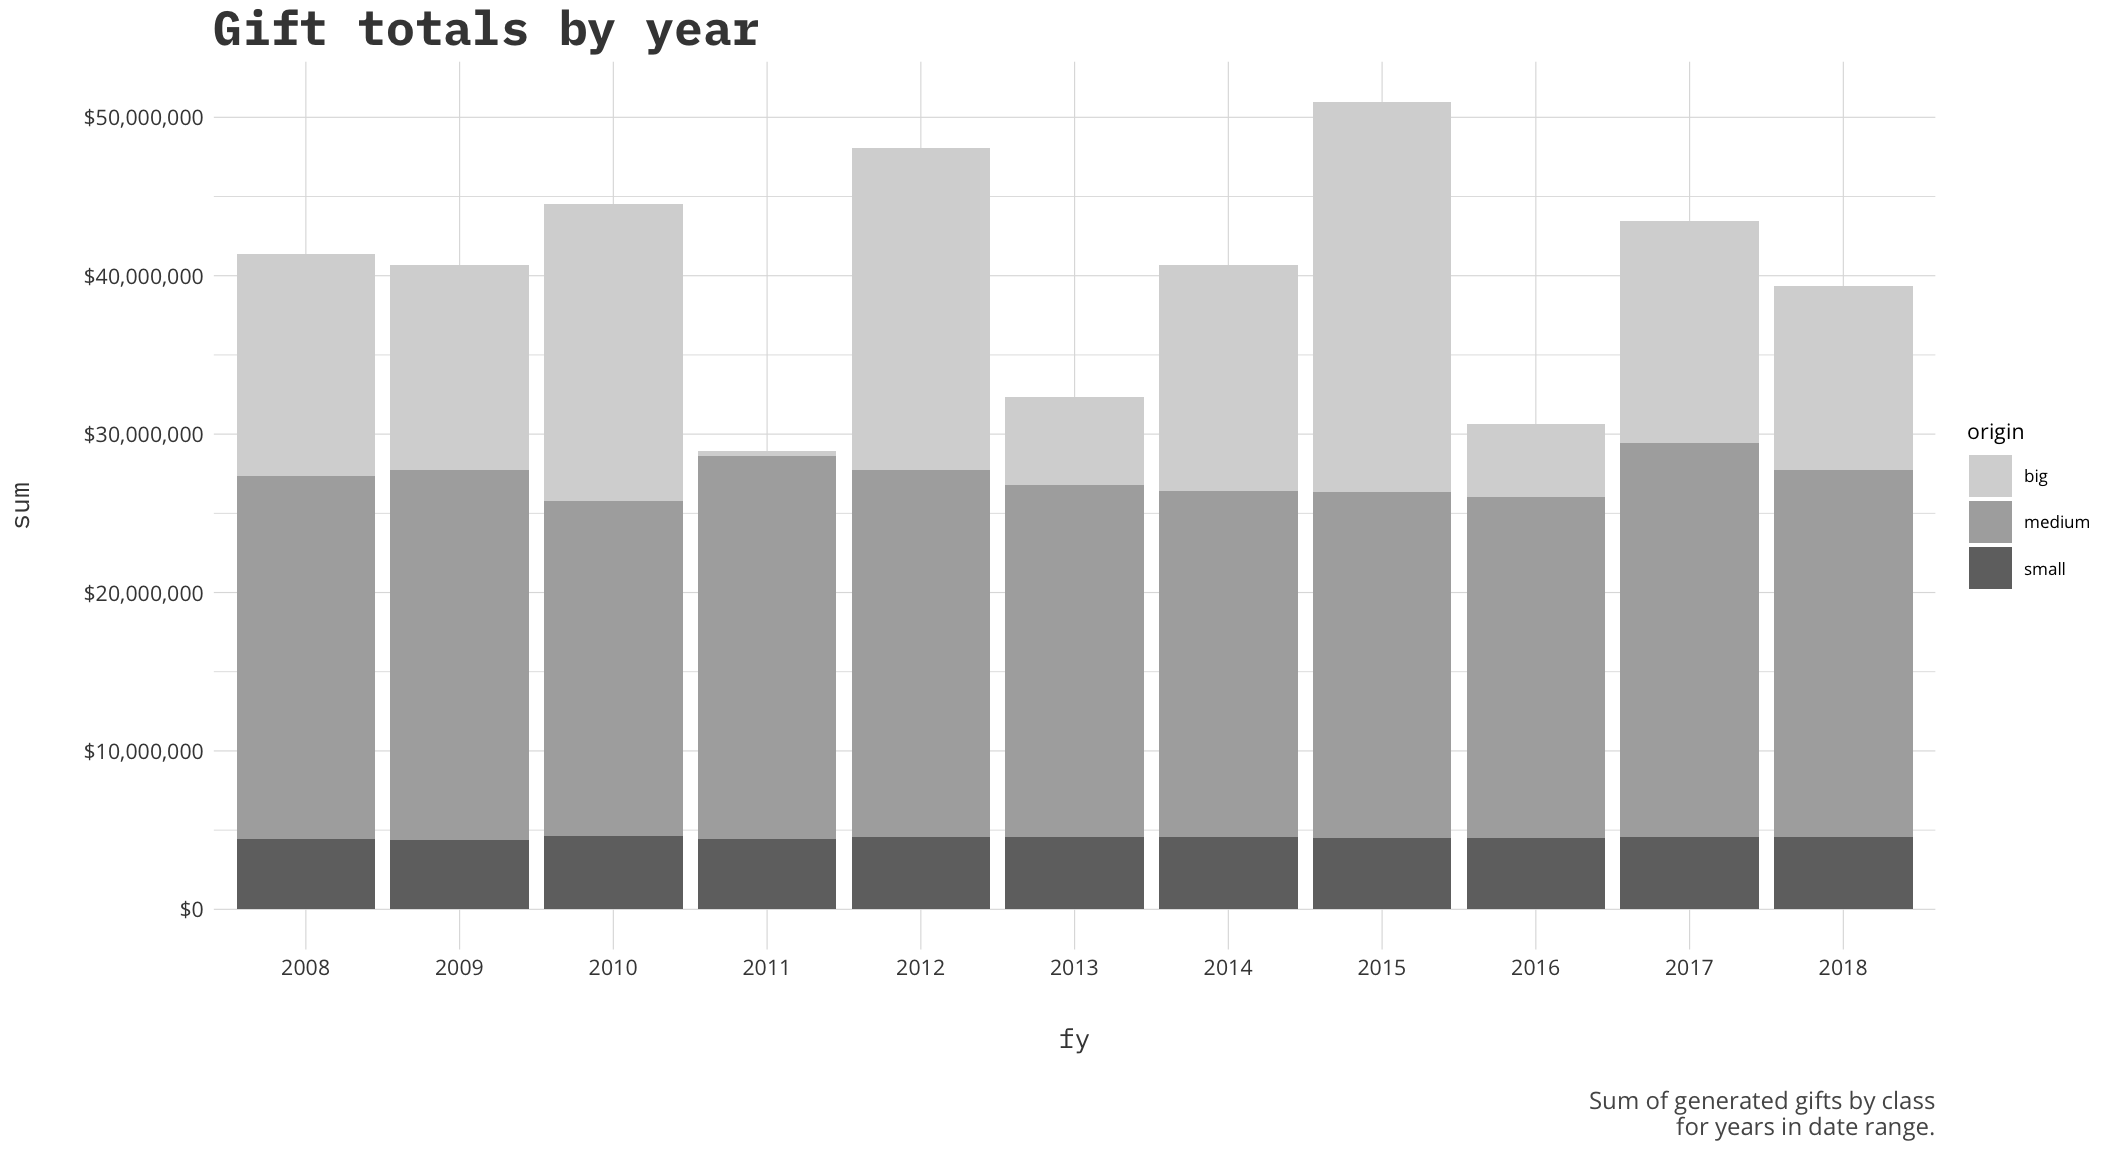
This data will change each time you run it and it always interesting to see what years come out ahead. I think the next logical step then is to see who are our top donors.
giving.sums<-gifttable %>%
  group_by(id,full,fy) %>%
  summarize(sum=sum(amount),n=n())

most<-giving.sums %>%
  arrange(-sum) %>%
  ungroup() %>%
    slice(1:50)

ggplot(most,aes(x=reorder(full,-sum), y=sum))+
  geom_bar(stat='identity')+
  scale_y_continuous(labels = scales::dollar)+
  a_theme()+
  theme(axis.text.x = element_text(angle = 90))+ #labels
  labs(title='Highest Donors',
       subtitle='The top 50 donors by sum of their generated gifts',
       x='',
       y='')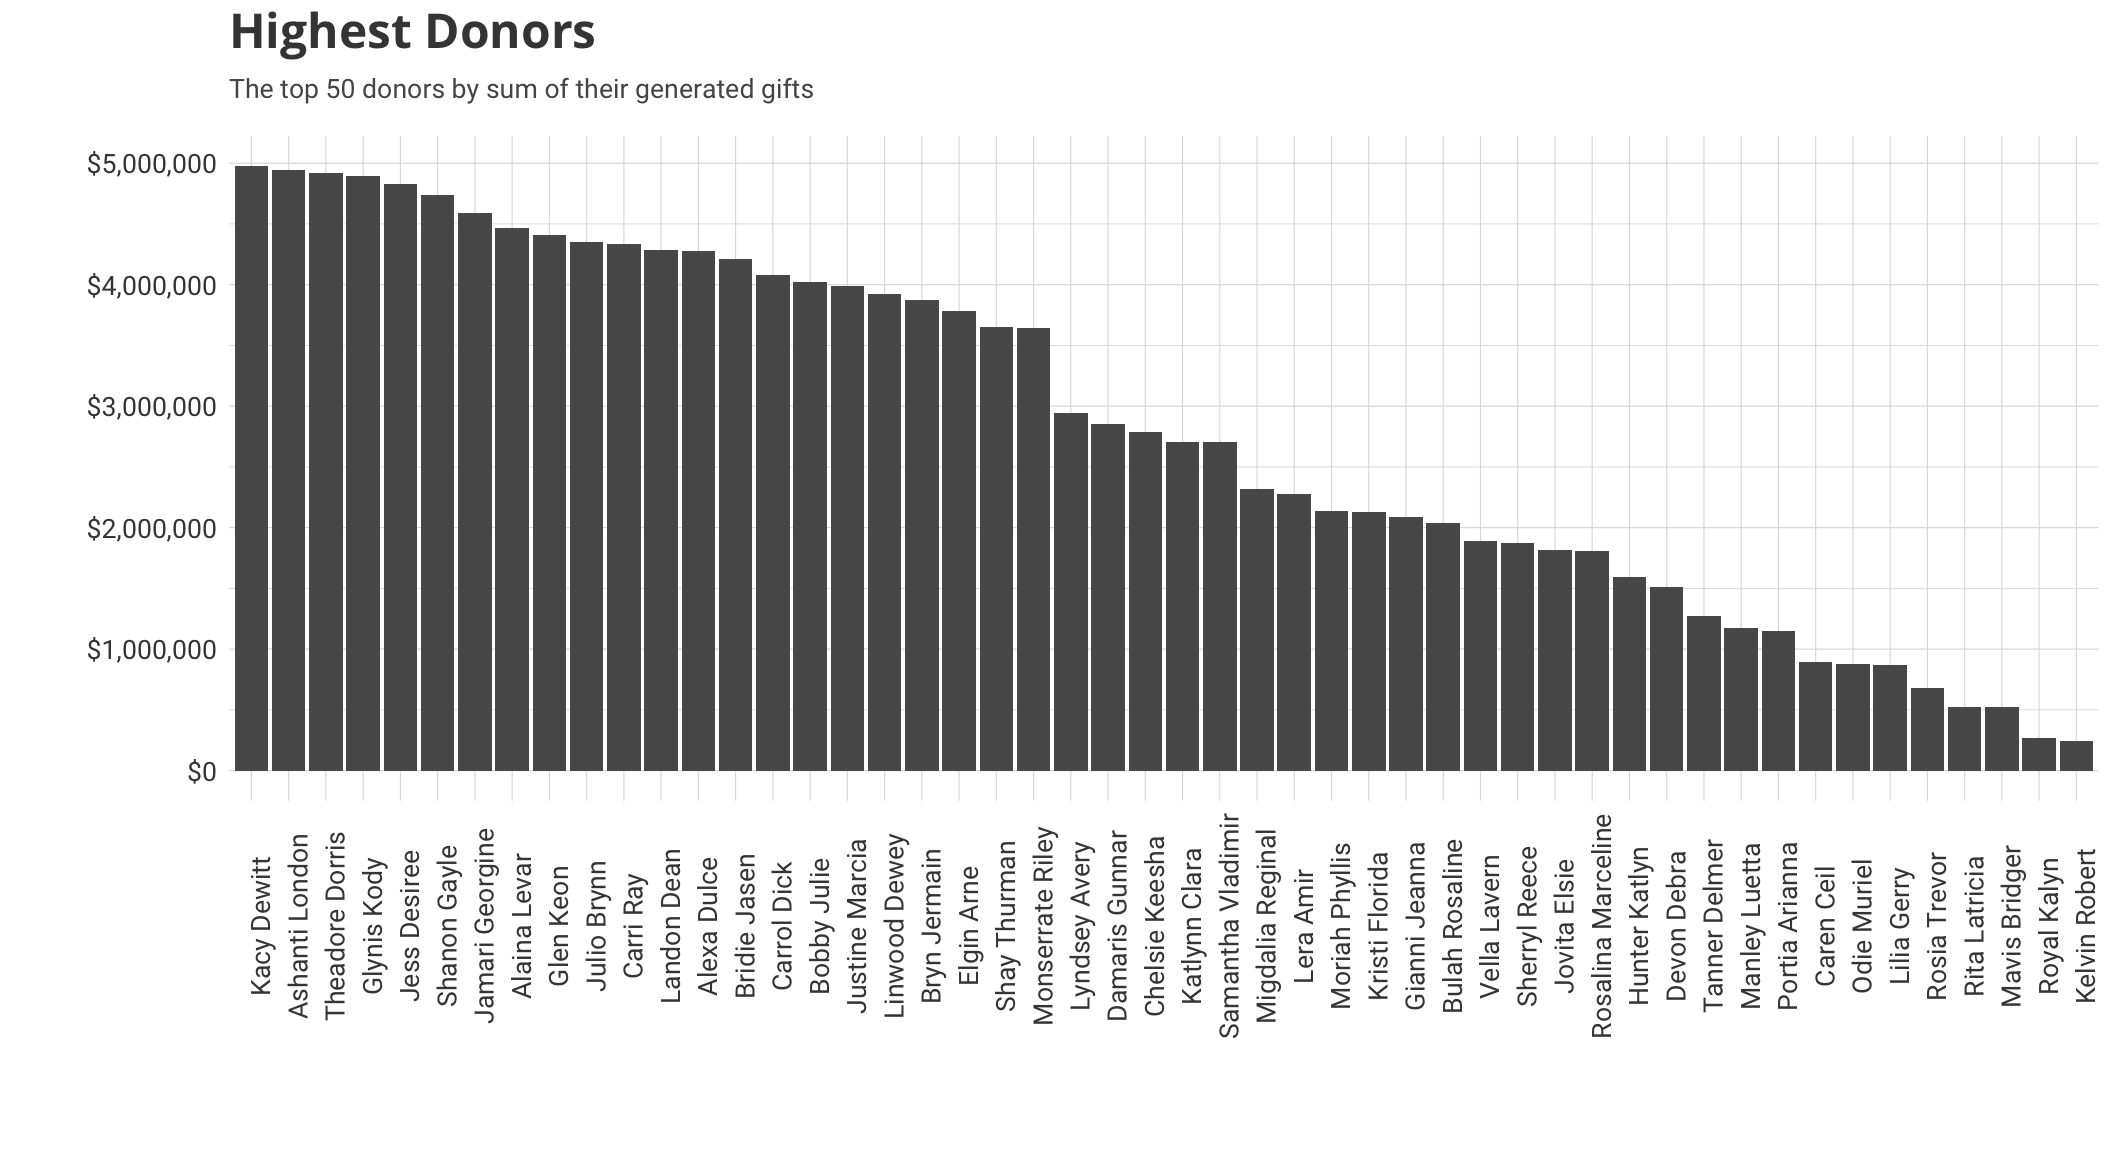
There we are. Now that we have a list of donors, and gifts, we could add attributes, randomly generate groups, add gift officers or countless other operations to help share our ideas. Some clients of mine have used this data for training purposes and are very happy with the customization options. Using these principles you could add development officers randomly to help create portfolios that can open new avenues of analysis. If you are looking for more information on the data generated, how to make changes or looking for specific pieces to be added feel free to drop me a line.